Trying to gauge the workload of a database on any given day can pose quite a challenge. A straightforward question supported by basic Database Activity Monitoring might not yield an insightful answer if it’s stripped of context, cluttered with arbitrary numbers, and missing crucial details. So, what’s the right way to address this query?
The Solution to Database Activity Monitoring
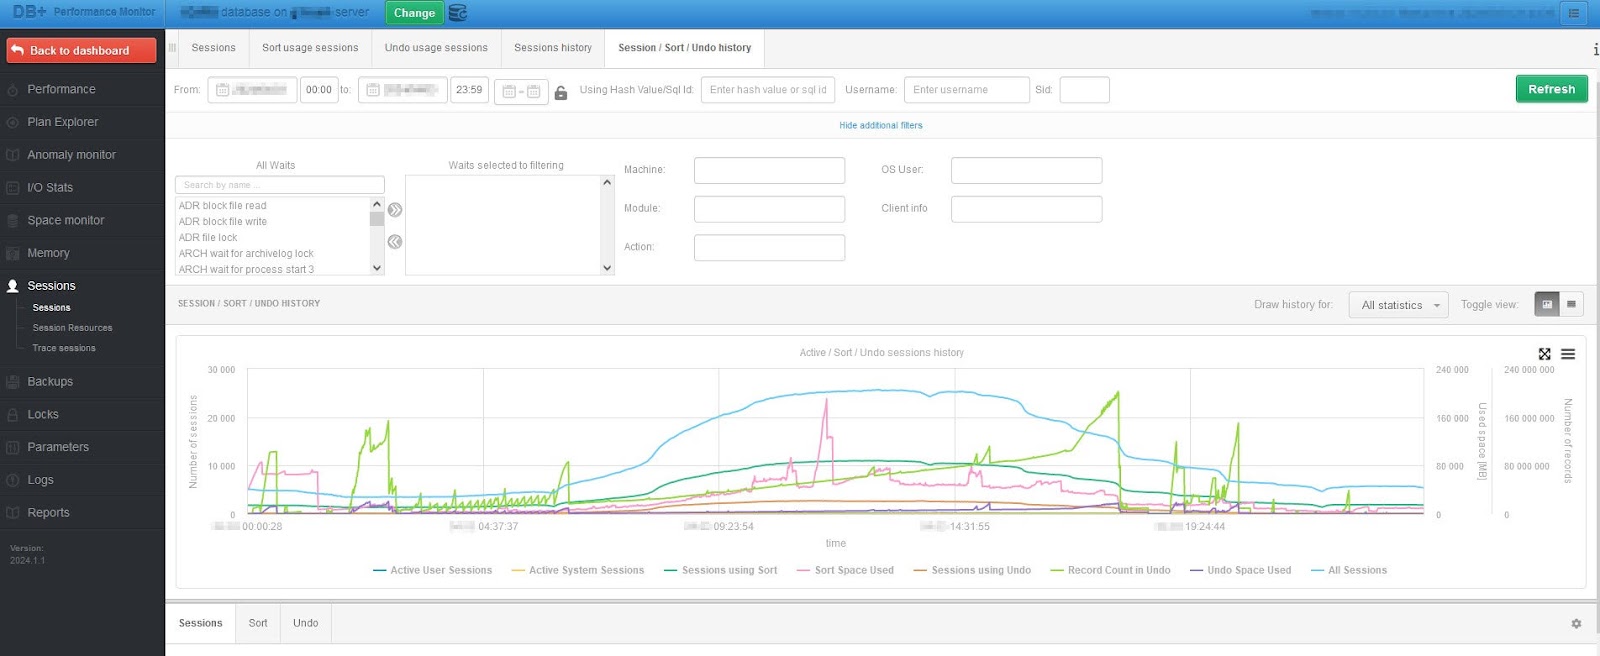
The solution is more visual than numerical—a single image can capture the essence of the day’s database activity. In DBPLUS, this process is simplified. Here’s how you can visualize the database’s day:
- Navigate in DBPLUS to your database selection.
- Go to Database Analysis > Sessions > Session/ Sort/ Undo history.
- Switch the view from the grid to the chart.
- Choose the relevant date and click “Refresh”.
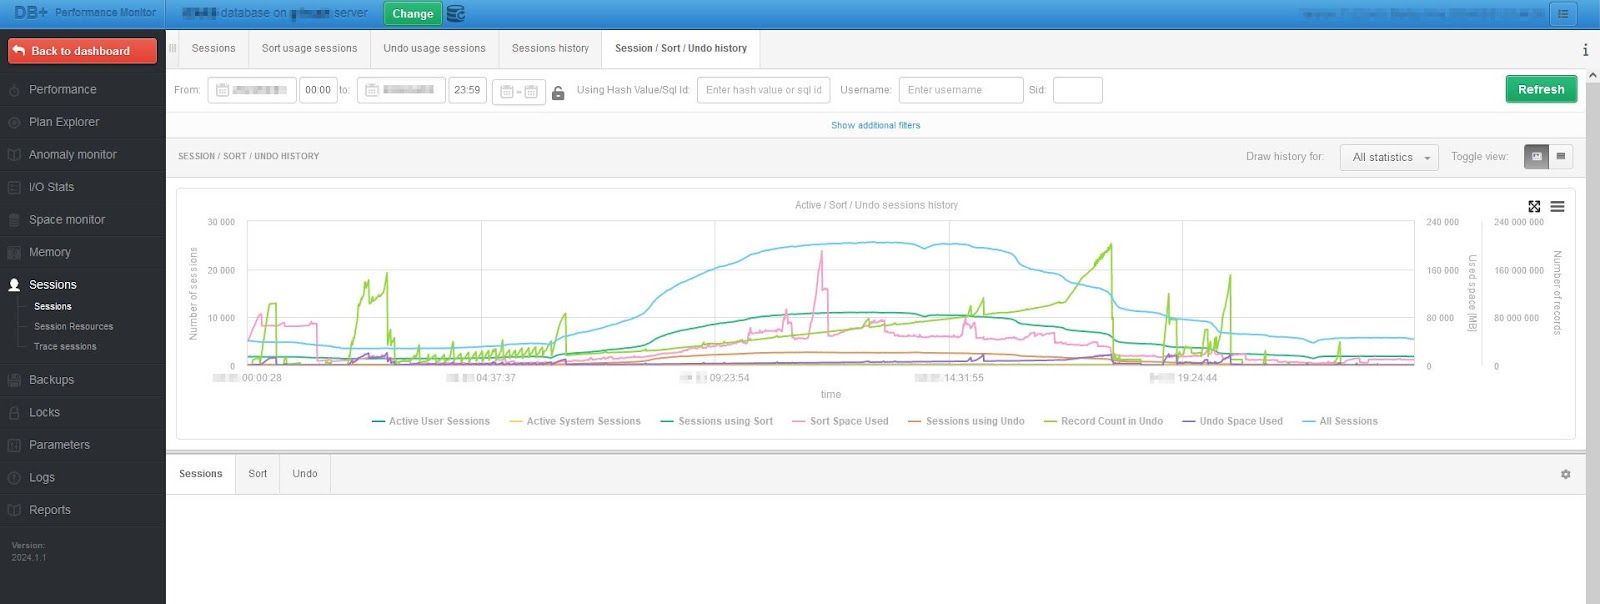
This image paints a comprehensive picture of the database instance’s activity throughout the selected day – a quick insight at one quick glance. However, understanding this data fully requires a bit more effort.
Getting Deeper into the Data
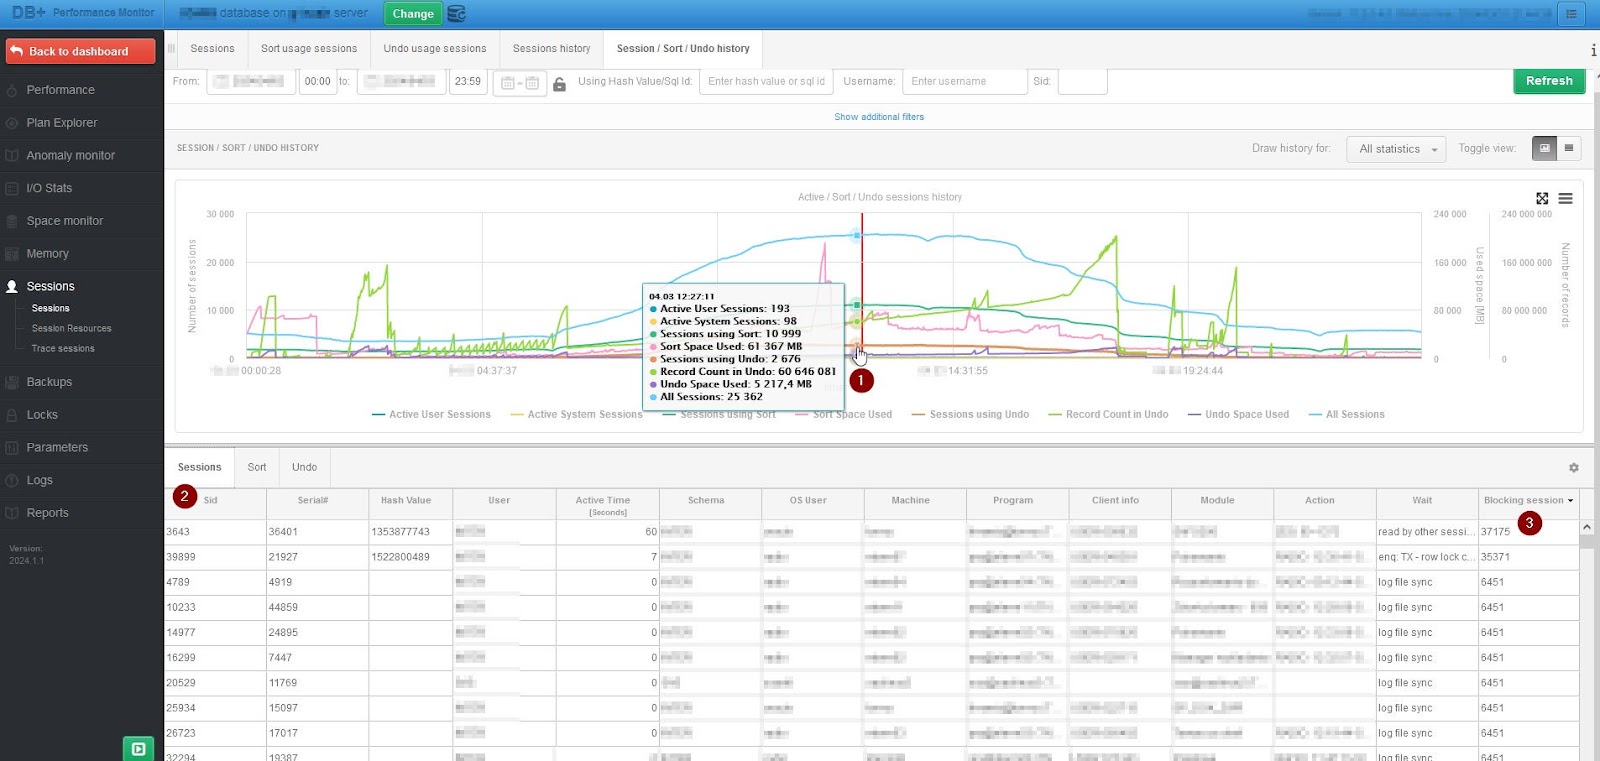
By selecting a specific point on the image, say point (1), you receive eight metric values. Further exploration can be done by accessing the “Sessions” tab, where information about active sessions at the time of the snapshot is available. Sorting these sessions by “Blocking sessions” can highlight any stopped session during this period.
For an even deeper analysis, the following image can be referenced:
Sessions Blocking SQL Text
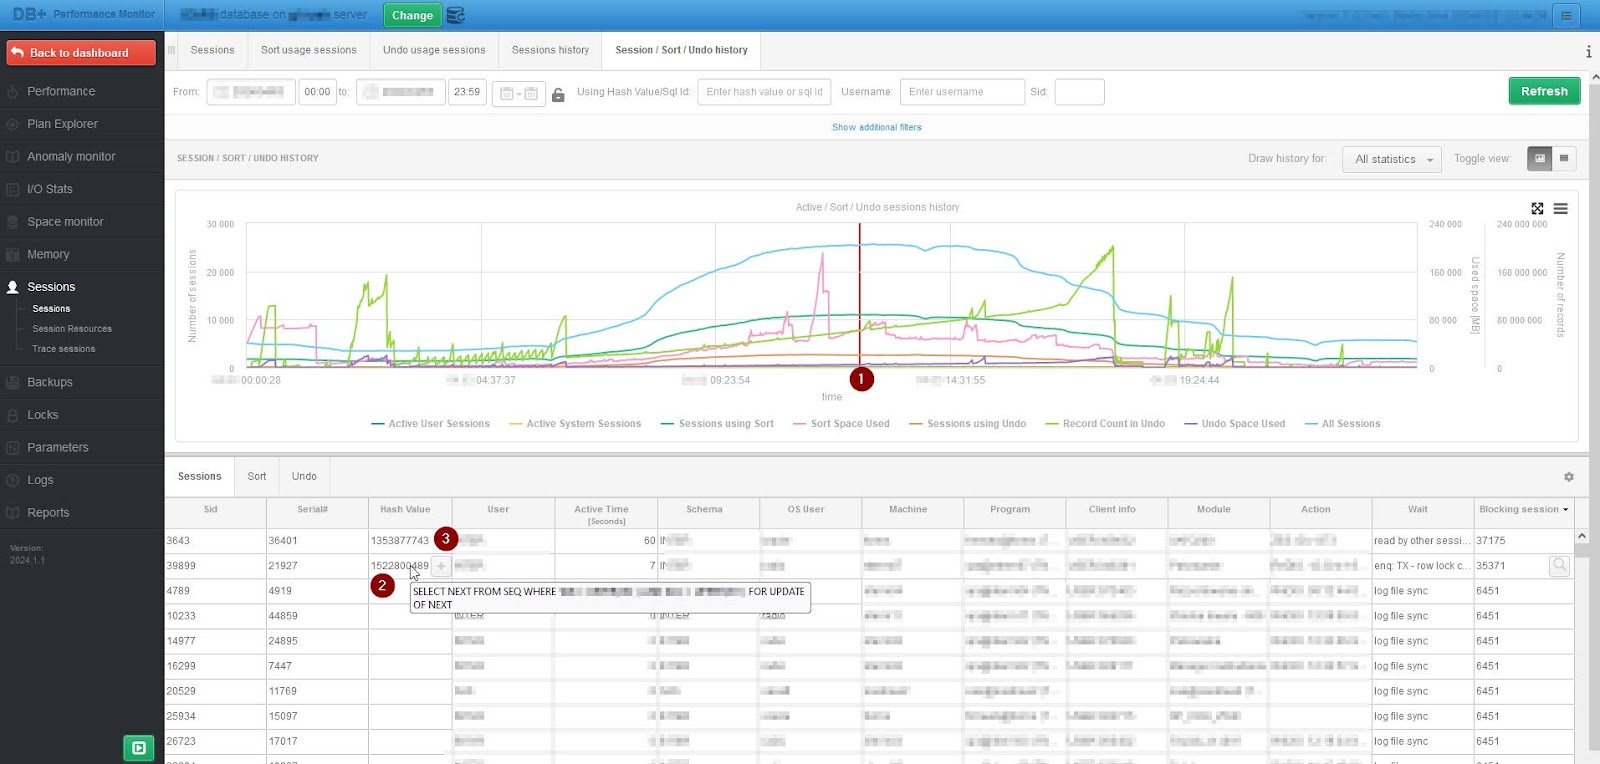
Pointing at (1) takes us back to the snapshot without showing metric values until you hover over it. The “Hash Value” field, when hovered over, displays the SQL text, which in this instance involves obtaining new values for sequences. By clicking the “+” symbol beneath point (3), the SQL text is displayed in the “SQL Details” tab for closer inspection.
Peak Period Analysis – Sessions Sort
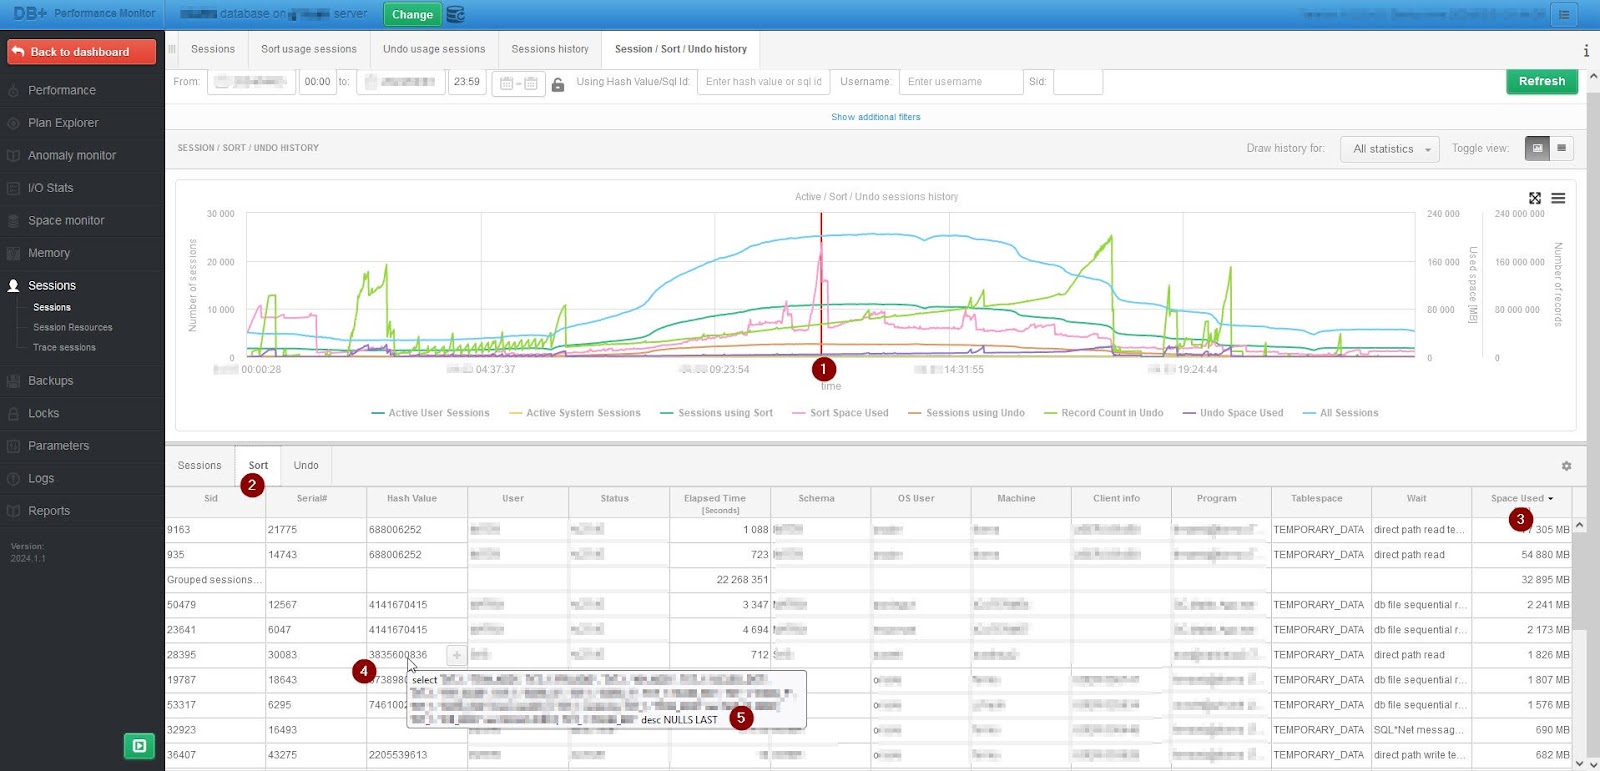
This image targets the activities during peak sorting periods. It marks the time frame under scrutiny and highlights active tabs like “Sort.” It suggests sorting by the “Space Usage” column to identify significant operations, as shown in point (3). Hovering over the “Hash Value” reveals SQL text related to the sorting operation.
Sessions Undo Analysis
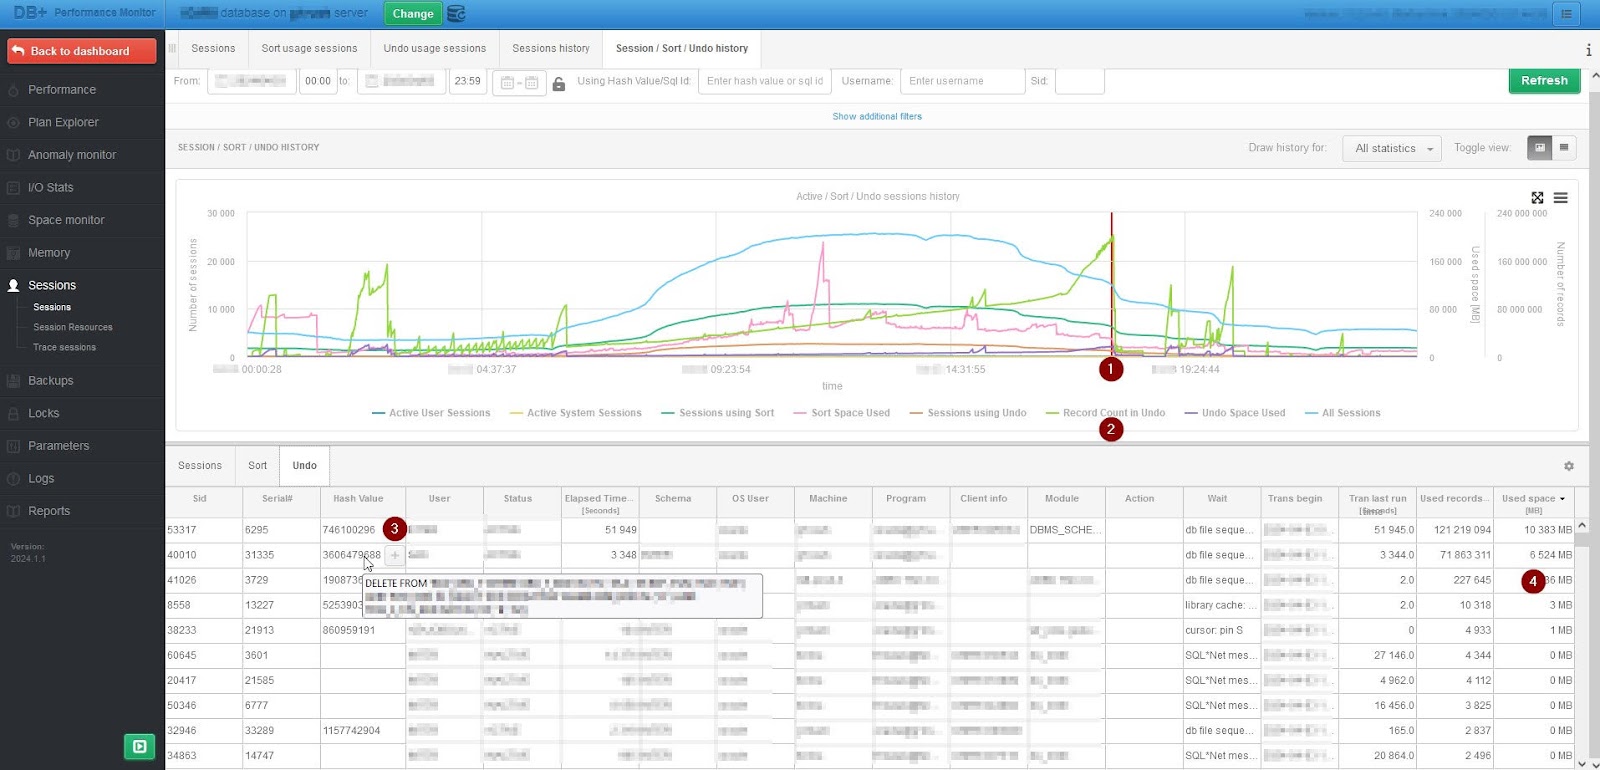
Lastly, let’s look at the peak undo usage times. The selected snapshot shows when the “Undo” count was highest, guiding us to sort by “Used space” to find significant operations, like a delete command, which usually consumes considerable UNDO space.
Applying this Type of Database Activity Monitoring More Broadly
This method isn’t just for typical days; it can be effectively used to analyze more problematic days by applying appropriate filters. This allows for a focused examination of specific programs, modules, or even machines, making it a versatile tool in database management.
This approach to database analysis and database activity monitoring with DBPLUS simplifies the understanding of how busy a database is on any given day. It replaces the guesswork with visual insights, making it easier for database administrators to make truly informed decisions and deal with optimizations. It means having data over a longer period, making it possible to analyze over weeks or months.
The post How Busy Was the Database Today? – Database Activity Monitoring Done Right appeared first on DBPLUS Better Performance.